The goal of this project was to find an interactive visualization that is interesting or well done, and complex enough for analysis and critique. I chose Smaart by Rational Acoustics. Smaart is a real-time audio analysis software commonly used for measuring and optimizing sound system performance.
Purpose Of Visualization
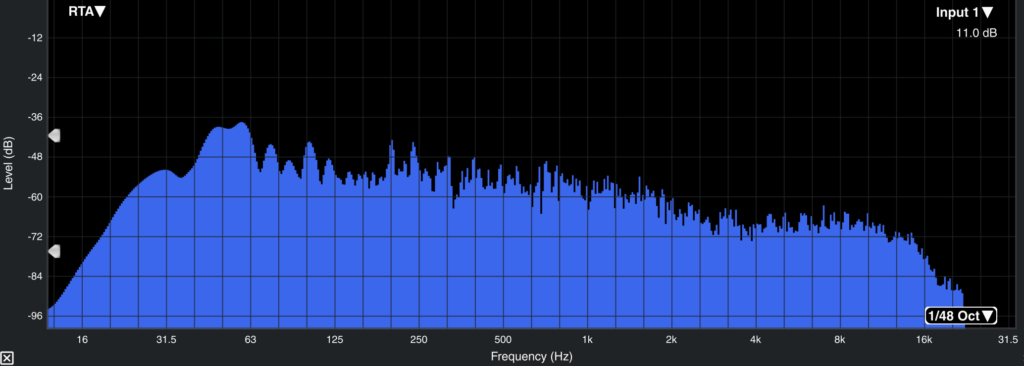
Spectrum
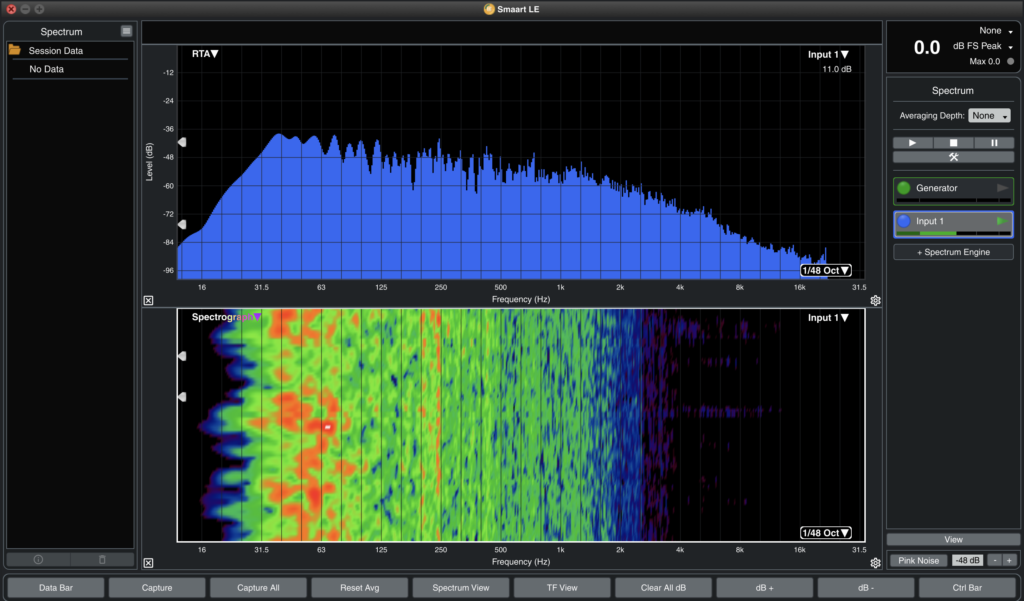
The spectrum is usually displayed in a graph format known as a frequency response plot or a spectral plot. This plot displays the amplitude (or level) of the audio signal at each frequency, typically represented on a logarithmic frequency scale.
The spectrum in Smaart can be used to identify various issues in an audio system, such as frequency response imbalances, resonances, and phase cancellations. By analyzing the spectrum, audio engineers can adjust the system’s equalization, delay, and other parameters to achieve a more accurate and balanced sound.
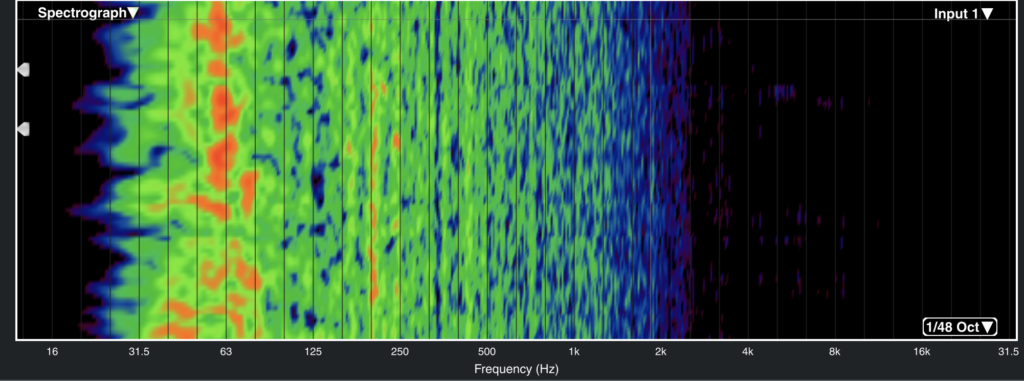
Spectrogram
Unlike a static spectrum that displays only the amplitude of the signal at each frequency at a given moment in time, a spectrogram shows how the signal’s frequency content changes over time. The spectrogram can be useful in identifying time-varying phenomena, such as transients, resonances, and other complex frequency behaviors.
In Smaart, the spectrogram is usually displayed as a 2D color-coded graph, where the x-axis represents time, the y-axis represents frequency, and the color or intensity represents the amplitude of the signal at each point in time and frequency. The spectrogram can be used to visualize the frequency content of an audio signal as it changes over time, making it easier to identify and diagnose problems in a sound system.
The spectrogram is often used in combination with other analysis tools in Smaart, such as the frequency response plot and transfer function measurement, to provide a more comprehensive analysis of a sound system’s performance.
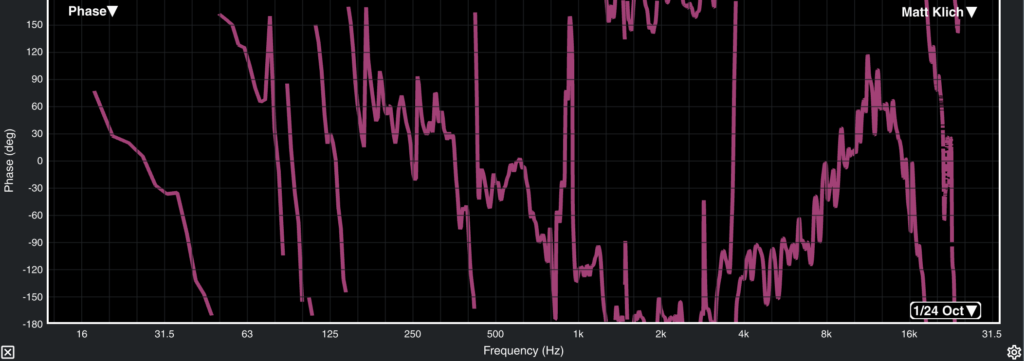
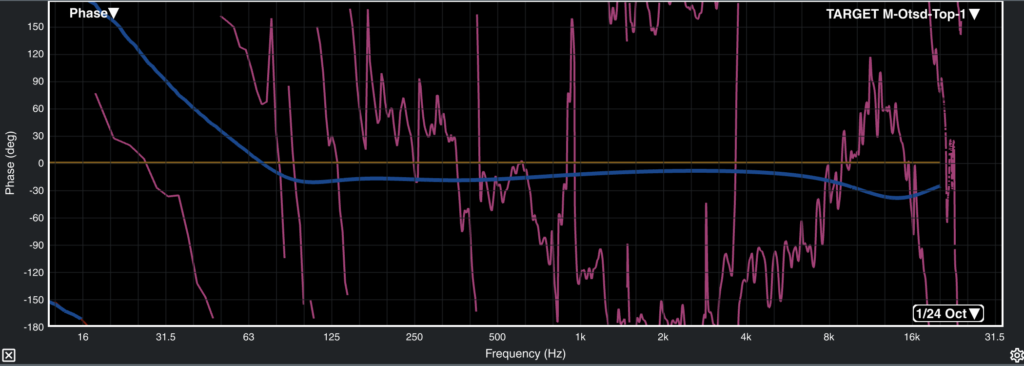
Phase
Phase refers to the shift in timing between different parts of an audio signal that have the same frequency. When the different frequency components of an audio signal are in phase, their peaks and troughs align with each other, resulting in a stronger, more coherent signal. When they are out of phase, their peaks and troughs do not align, resulting in cancellation or weakening of the signal.
In Smaart, phase is typically displayed as a graph or plot that shows the phase relationship between two signals, often represented as a phase angle in degrees. The phase plot can be used to analyze the phase coherence between the different frequency components of an audio signal, allowing audio engineers to identify and correct phase issues such as phase cancellations or phase shifts caused by different signal processing elements.
The phase plot is often used in conjunction with other analysis tools in Smaart, such as the frequency response plot and transfer function measurement, to provide a more complete analysis of a sound system’s performance.
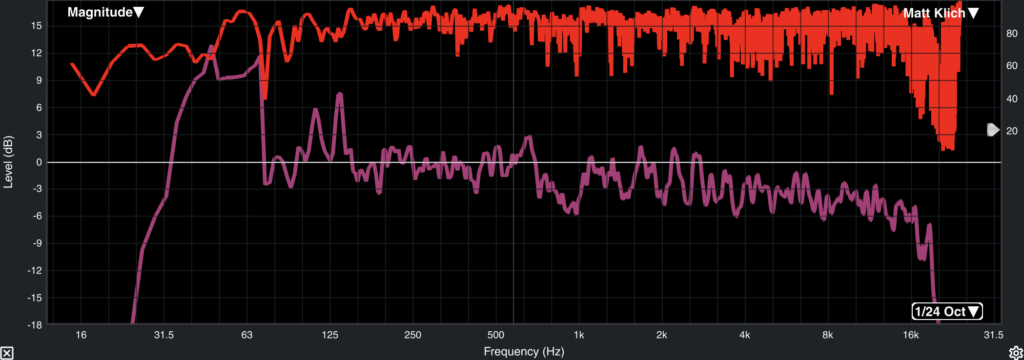
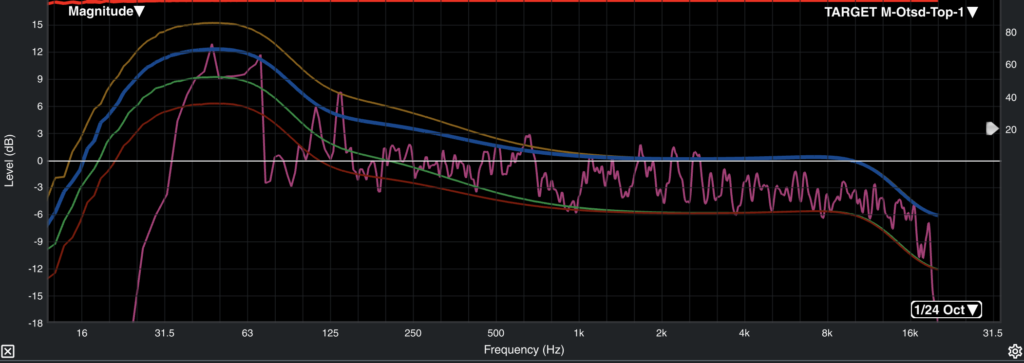
Magnitude
The magnitude is typically displayed as a graph or plot that shows the amplitude of an audio signal at each frequency, usually represented on a logarithmic frequency scale. This type of graph is commonly referred to as a frequency response plot or spectral plot.
The magnitude plot is useful for analyzing the frequency response of a sound system or room. By comparing the magnitude plot of an audio signal at the input and output of a system, audio engineers can identify any frequency response anomalies or imbalances caused by the system or room.
The magnitude plot is often used in conjunction with other analysis tools in Smaart, such as the phase plot and transfer function measurement, to provide a more complete analysis of a sound system’s performance.
Live IR
The Live IR (Impulse Response) demonstrates the time and frequency characteristics of a sound system or room’s response to a short-duration, broadband audio signal, commonly known as an impulse.
Live IR is typically displayed as a graph or plot that shows the amplitude of the audio signal over time, usually represented in milliseconds. The Live IR plot is useful for analyzing the time-domain characteristics of a sound system or room, such as reflections, echoes, and reverberation.
By analyzing the Live IR plot, audio engineers can identify the time delay between the direct sound and the reflections, and the frequency-dependent characteristics of the reflections. This information can be used to adjust the system’s equalization, delay, and other parameters to optimize the system’s performance and improve its overall sound quality.
The Live IR plot is often used in conjunction with other analysis tools in Smaart, such as the frequency response plot and spectrogram, to provide a more comprehensive analysis of a sound system or room’s performance.
Coherence
Coherence is typically displayed as a graph or plot that shows the coherence value between two signals at each frequency. The coherence value is represented as a number between 0 and 1, where 1 indicates perfect correlation and 0 indicates no correlation. In Smaart it is reversed.
The coherence plot is useful for analyzing the similarity or consistency between two signals, such as the input and output of a sound system. By comparing the coherence plot of these two signals, audio engineers can identify any inconsistencies or variations in the system’s response that may be caused by external factors such as noise or interference.
The coherence plot is often used in conjunction with other analysis tools in Smaart, such as the transfer function measurement, to provide a more complete analysis of a sound system’s performance. By analyzing the coherence and transfer function, audio engineers can identify any issues with the system’s response, such as phase shifts or frequency response imbalances, and make adjustments to improve the system’s performance.
The Data & Data Collection
Smaart uses audio data as input, typically obtained through a measurement microphone or a direct signal input. The software receives the audio signal from the input device, analyzes it in real-time, and provides various measurement results and visualizations based on the analysis.
The data used by Smaart can vary depending on the type of analysis being performed. For example, when analyzing the frequency response of a sound system, Smaart measures the amplitude of the signal at different frequencies, typically between 20 Hz to 20 kHz. When analyzing the phase coherence between two signals, Smaart measures the phase angle difference between them at different frequencies. When analyzing the time-domain characteristics of a sound system, Smaart measures the amplitude and time delay of reflections and other acoustic phenomena in the room.
Smaart also uses various statistical methods to analyze the data and calculate various measurement results, such as coherence, transfer function, impulse response, and others. The software can display the results in various graphical forms, including graphs, plots, and spectrograms, making it easier for audio engineers to visualize and understand the measurement data.
User Base
Live sound engineers use Smaart to tune and optimize sound systems for concerts, festivals, conferences, and other live events. They use Smaart to measure and adjust the frequency response, phase, and time alignment of different components of the sound system, including loudspeakers, subwoofers, and monitors, to ensure that the sound is clear, balanced, and consistent throughout the audience area.
System designers and acousticians use Smaart to design and model sound systems and rooms, to simulate their acoustic performance, and to predict and analyze the impact of different design options. They use Smaart to measure and evaluate the acoustic properties of different materials and constructions, and to optimize the acoustic treatment of rooms and spaces.
Audio consultants use Smaart to provide technical support and advice to clients, to measure and evaluate the performance of their sound systems and rooms, and to recommend and implement solutions to optimize the sound quality and performance of their systems.
User Learning
There are several ways that people can learn about Smaart:
Audio Engineering Education: Many audio engineering and production programs include Smaart in their curriculum, and students learn how to use the software as part of their coursework.
Workshops and Training: Smaart training courses and workshops are available from various sources, including Smaart’s official website, audio equipment manufacturers, and audio engineering training schools. These courses typically provide hands-on training on how to use the software for audio measurement and analysis.
Online Resources: There are a variety of online resources available to learn about Smaart, including tutorials, forums, and blogs. Smaart’s official website also provides extensive documentation and support resources, including a user manual, knowledge base, and video tutorials.
Industry Events: Smaart is often featured in audio industry events and conferences, such as the Audio Engineering Society (AES) Convention, where audio professionals can learn about the latest developments in audio measurement and analysis tools.
Networking: Audio professionals often learn about new tools and techniques from their colleagues and peers in the industry. Networking and collaboration with other audio professionals can be an effective way to learn about Smaart and other audio measurement and analysis tools.
Inference Of Visualization
Effectiveness
Smaart’s visualizations are highly effective in providing real-time feedback on the performance of a sound system or room.
The software provides a wide range of visualizations, discussed above. These visualizations allow audio engineers to easily identify and analyze various acoustic phenomena, such as frequency response anomalies, phase shifts, reflections, and other issues that affect the sound quality of a system or room.
Smaart’s visualizations are highly customizable, allowing users to adjust various parameters such as frequency range, resolution, color scheme, and other display settings. This flexibility allows users to fine-tune the visualizations to their specific needs and preferences, making it easier to identify and diagnose issues in a sound system or room.
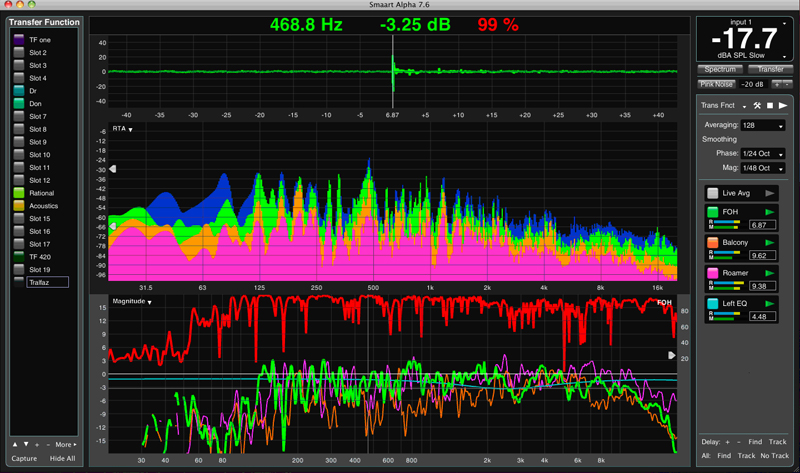
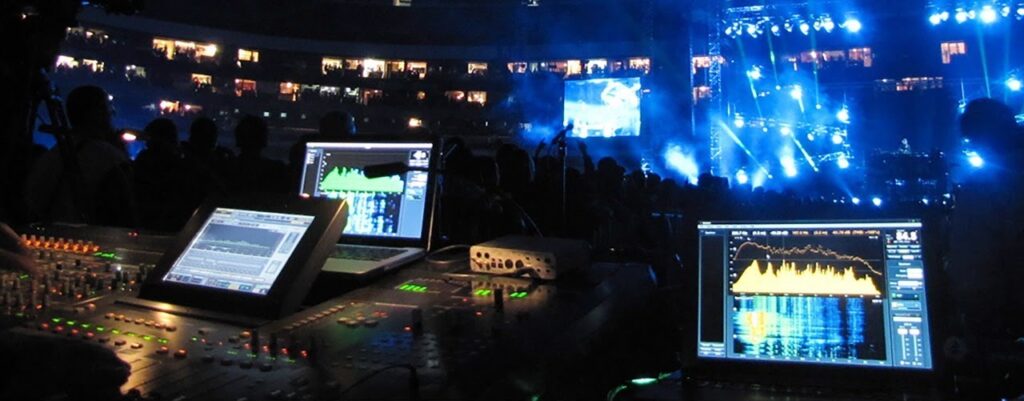
Furthermore, Smaart’s visualizations can be used in real-time (real time measurements taken in the photo below), which allows audio engineers to make adjustments to the system or room settings and immediately see the results in the visualizations. This enables them to quickly identify and correct issues, leading to a faster and more efficient optimization process.
Another plus is the averaging and captures that can stack (as shown below). This allows users to adjust frequency based on modified captures for the best sound.
Limitations
First, Smaart’s accuracy depends on the quality of the input signal and the measurement setup. For example, the accuracy of frequency response measurements can be affected by environmental factors such as noise, reflections, and interference. Therefore, it is important to ensure that the measurement setup is properly calibrated and that the measurement microphone is of high quality. Visualizations would then be messed up.
Smaart’s analysis is limited to the audio signals that are presented to it. While Smaart can provide insights into the performance of a sound system or room based on the measured data, it cannot directly diagnose or address hardware or equipment failures, which may require physical inspection or repair.
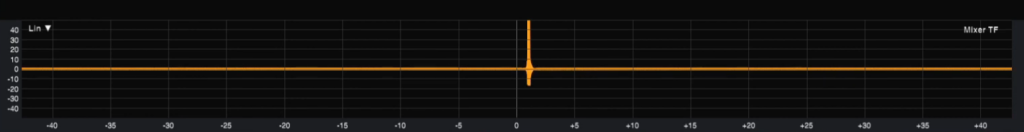
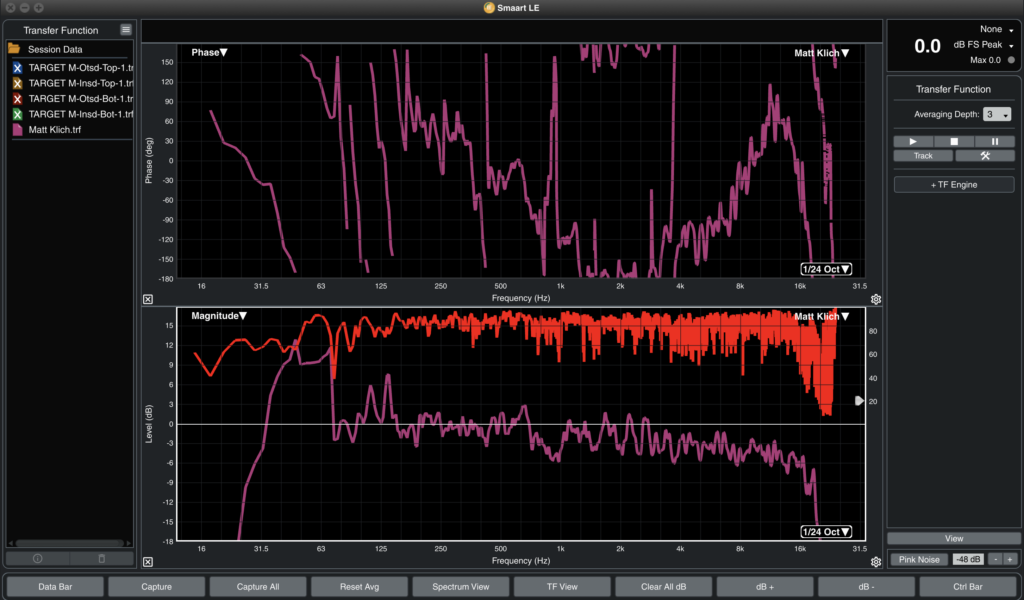
Smaart’s analysis is based on a set of assumptions and mathematical models that may not always accurately reflect real-world conditions. For example, Smaart’s transfer function (shown below) measurements assume that the system under test is linear and time-invariant, which may not always be the case.
Improvements
Smaart can be improved by:
-
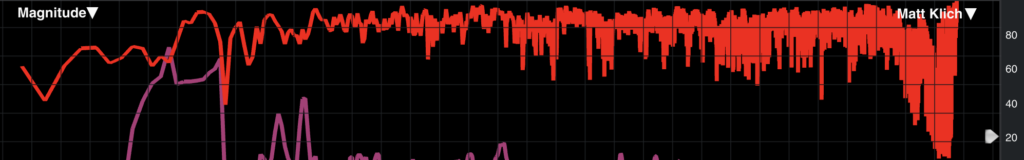
User Interface: While Smaart’s user interface is generally well-regarded for its depth and flexibility, it could potentially be improved to make it more intuitive and user-friendly for new users. Improvements could include more visual cues, more streamlined workflows, and better customization options. Sometimes the output becomes a bit congested, as shown below, so can be improved.
Better Learning Tools: Smaart lacks learning tools such as a manual, tooltips, and more.
-
Automation: While Smaart already includes a number of automated measurement and analysis tools, there is potential for further automation to speed up common tasks and improve efficiency. For example, the software could include automated feedback elimination tools or automatic calibration routines.
-
Machine Learning: Machine learning algorithms could be integrated into Smaart to provide more accurate and reliable analysis and modeling of audio systems and spaces. This could potentially lead to more accurate room EQ and acoustic treatment recommendations, as well as more efficient optimization of sound systems.
-
Integration with other software and hardware: Smaart already includes extensive integration with other software and hardware tools, but there is potential for further integration with other popular audio software and hardware tools. For example, tighter integration with digital audio workstations (DAWs) could enable more seamless measurement and analysis of recordings and mixes.
-
Cloud-based collaboration: Cloud-based collaboration features could be added to Smaart to enable remote collaboration and sharing of measurement data between different users and locations. This could be particularly useful for live sound engineers and audio consultants who work with clients in different locations or who need to collaborate remotely.